Blindsgalleria — $4.84 back for every $1 spent, across a full year of seasons
$38,475
closed revenue via Facebook Ads
4.84x
return on ad spend
337
qualified form leads
CA$25.80
blended cost per lead
CA$8,694
total ad spend, 14 months
20
projects closed & installed
Source: Meta Ads Manager + client-reported closed projects, 21 Apr 2025 – 3 Jul 2026. Revenue attributed to Facebook Ads; a further $540 project came via Google Ads.
It started with a cold DM
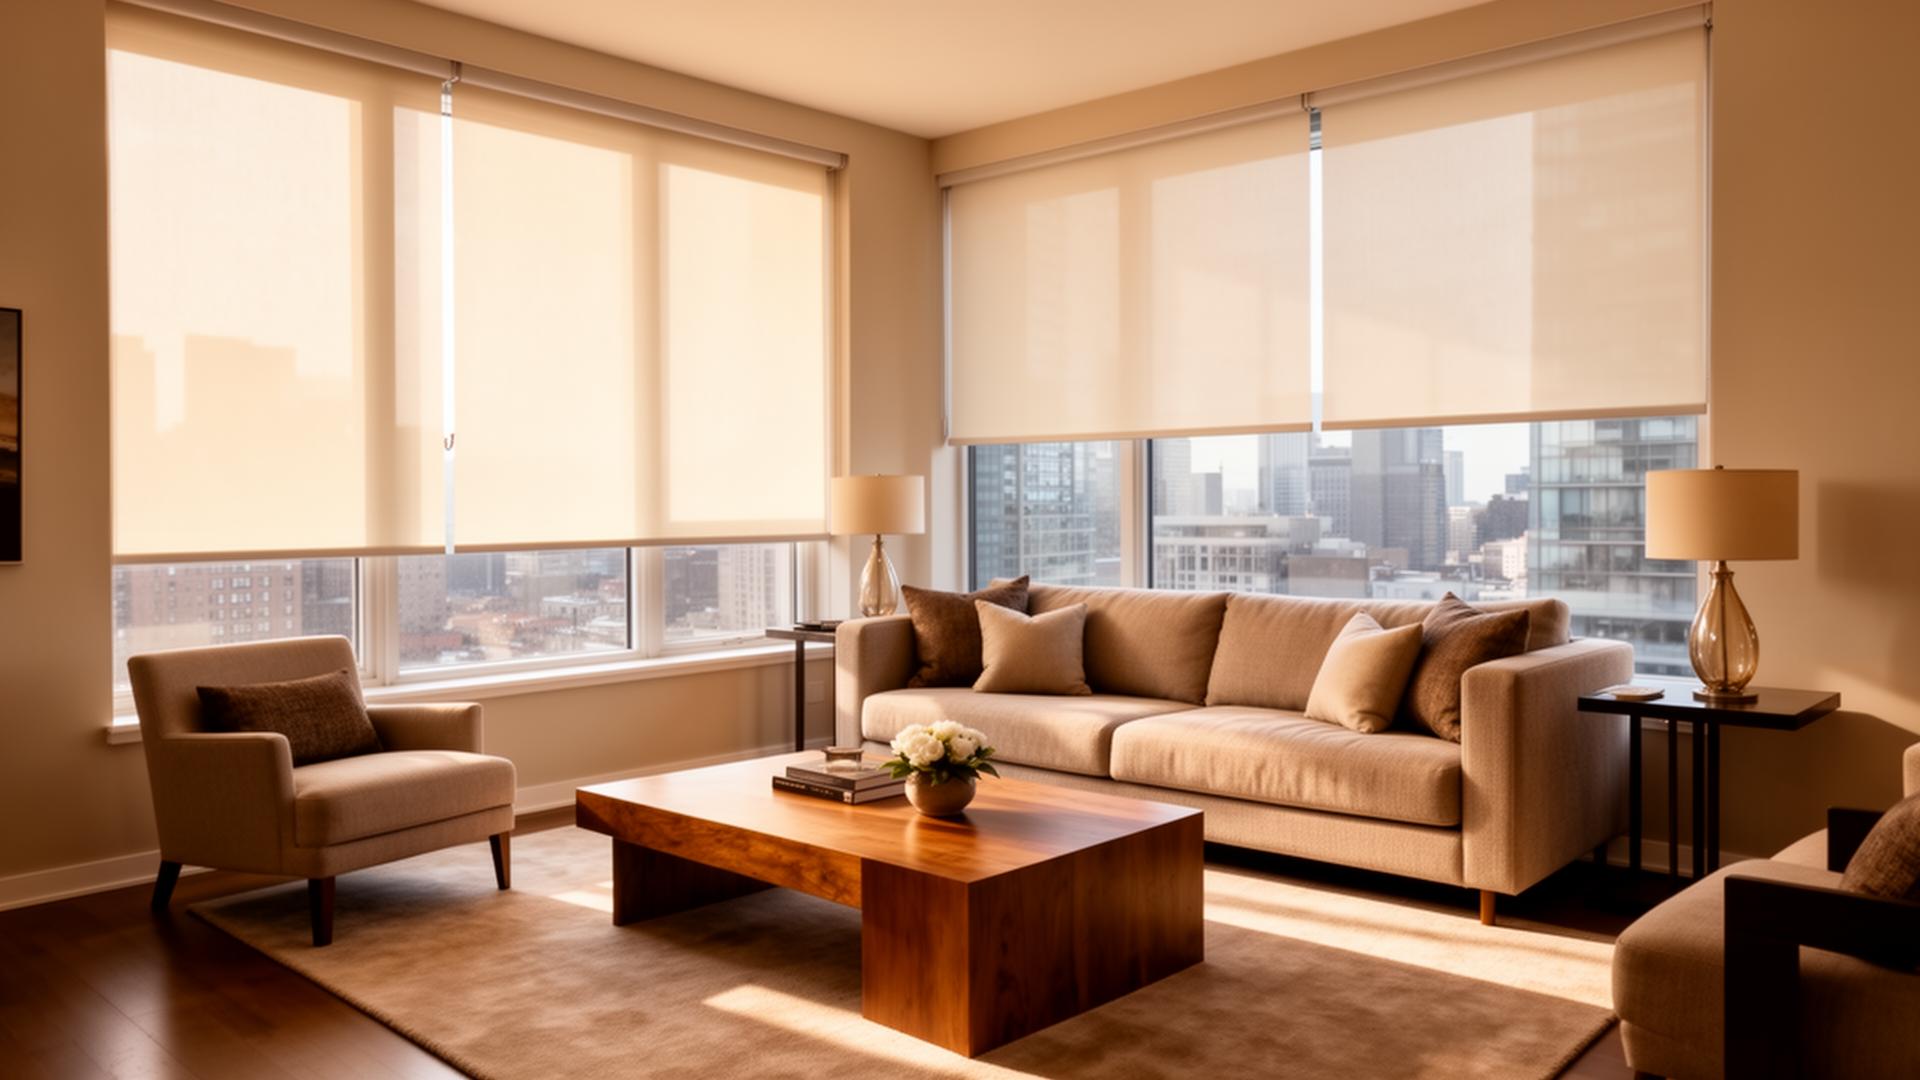
Blindsgalleria does beautiful custom window-covering work across Toronto and the GTA — but online, almost nobody could tell. The owner, Imran, was doing what most busy tradespeople do: posting AI-generated product images and hoping the algorithm would be kind. I sent him a cold DM with a simple pitch: your real installations are better ads than any generated picture, and paid distribution beats hoping.
Real jobs instead of AI images
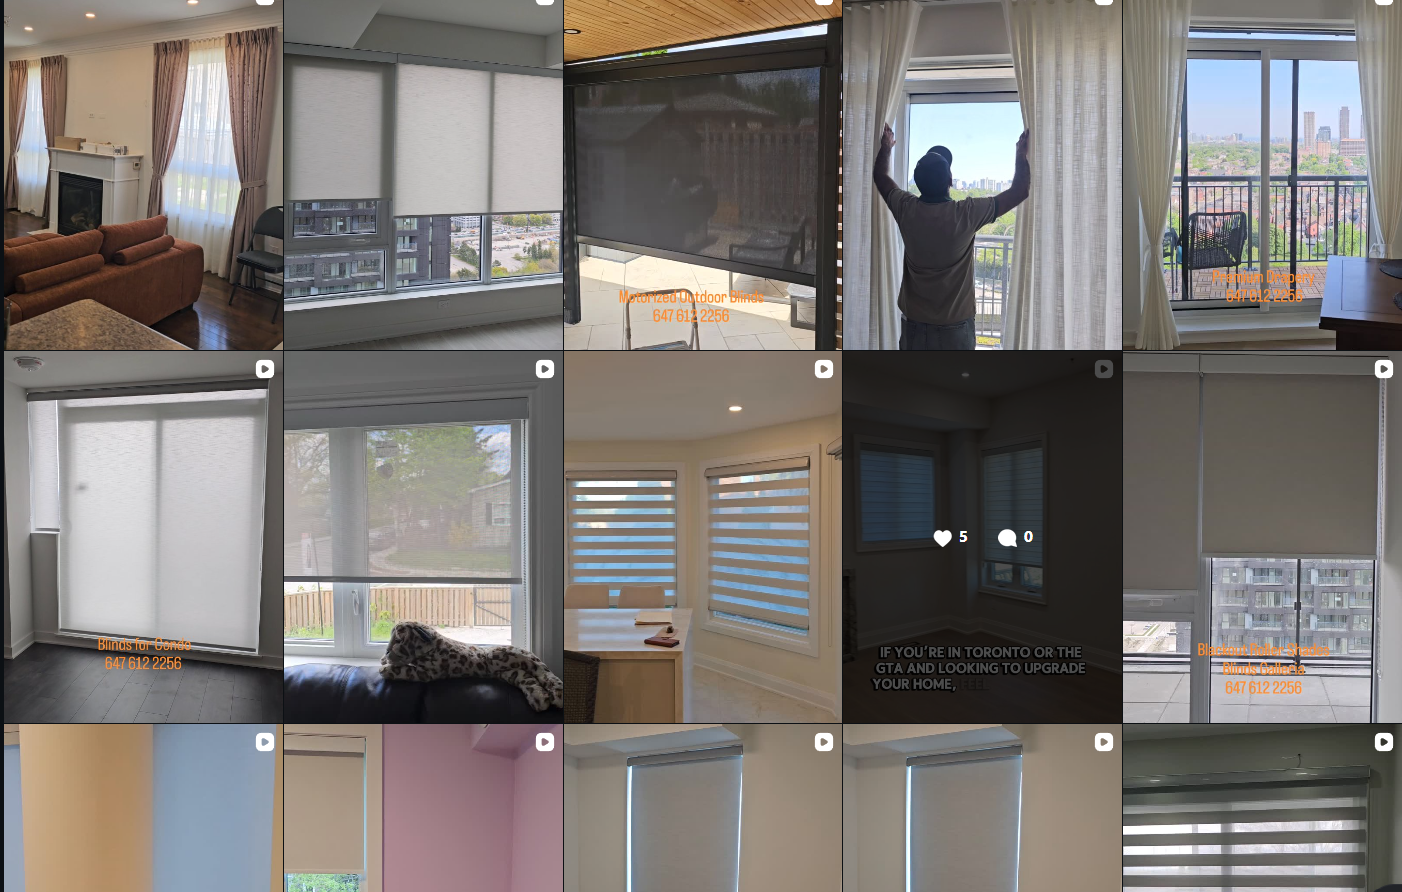
The creative strategy was the differentiator: actual installed jobs — real living rooms, real condos, real light coming through real zebra shades. A homeowner scrolling past sees a room that looks like theirs. Paired with a qualifying lead form, that's what turned browsing into 337 enquiries from people genuinely planning to buy.
Ruthless with budget — both ways
Five campaigns ran over 14 months, but the account was deliberately consolidated around one proven winner — the June 12 scaling campaign, which ran for nearly 13 months and delivered over 80% of all leads at a stable CA$25.48 per lead. A September test angle didn't convert, so it was killed at CA$108 — not CA$1,000. After the summer ramp, spend settled to roughly CA$450/month while lead flow held: the sign that targeting and creative had matured.
Revenue closed vs ad spend, by month
Same scale on purpose — revenue (blue) towers over spend (grey) in every closing month.
Revenue closed Ad spend Via Google Ads
Leads per month
Lead flow held steady all year — even through winter, when closes naturally slow and the pipeline fills for spring.
Best CPL months: Mar 2026 (CA$16.78), Dec 2025 (CA$17.83), May 2026 (CA$17.87).
The feed tells the story
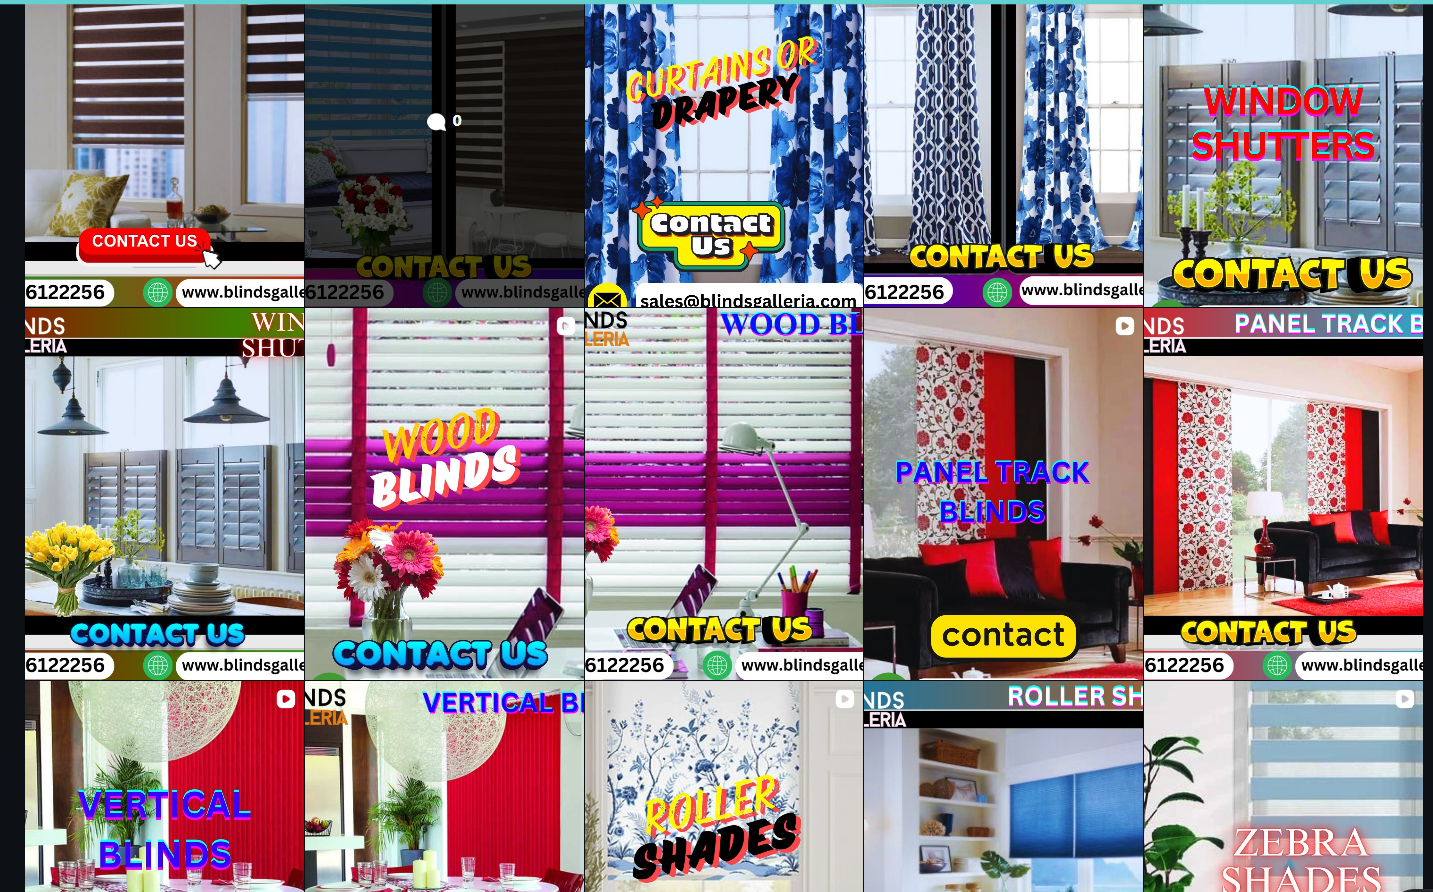
Same business, before and after. Left: AI & stock graphics shouting "contact us" into the void. Right: real installed jobs in real Toronto homes — the creative that fed the winning campaign.
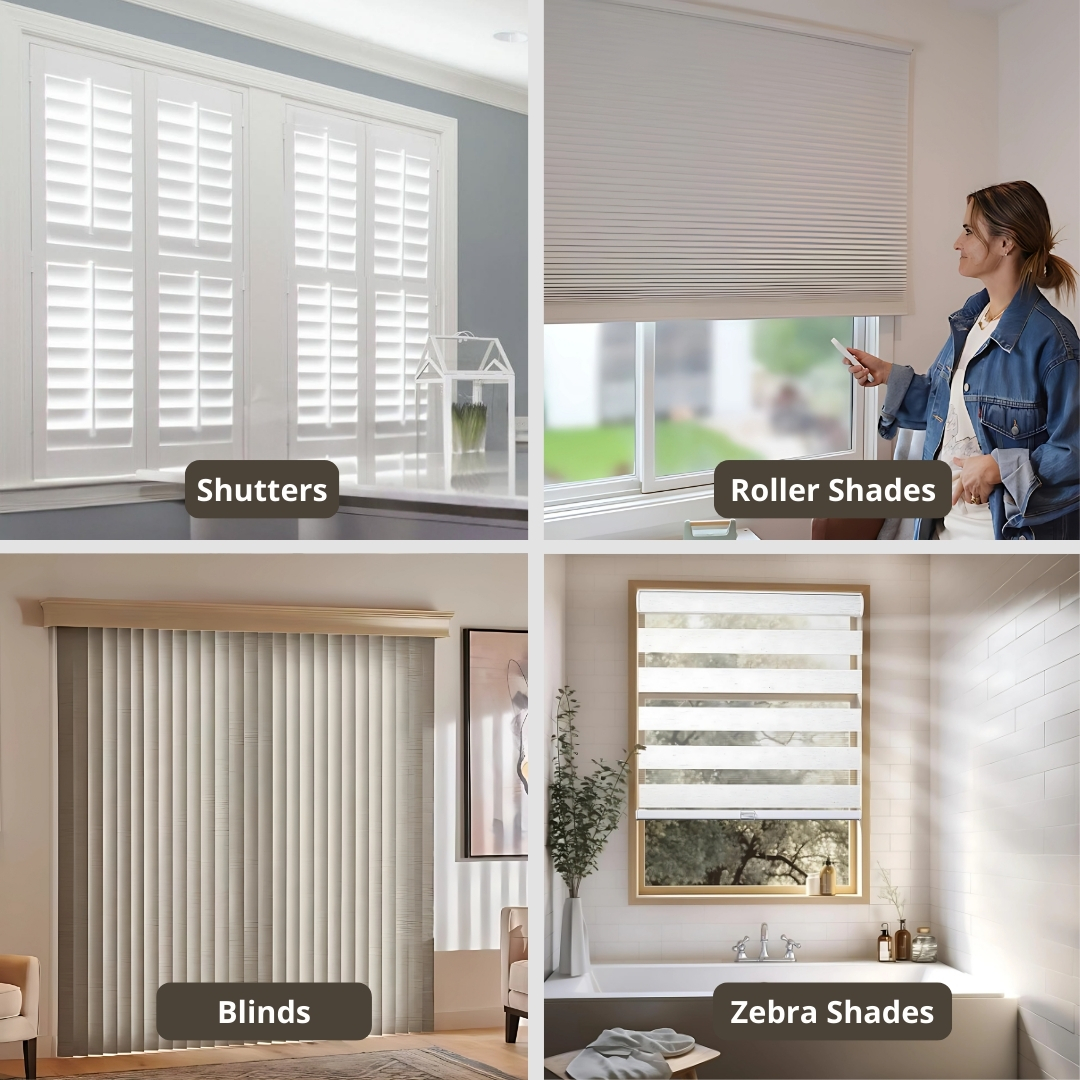
The actual winning creative — the four-product grid behind the June 12 scaling campaign.
What the year taught us
- Seasonality is real. Summer and late autumn closed hardest; deep-winter leads closed months later in spring. Revenue lags leads — panic in February loses you May's projects.
- One winner beats five experiments. 80%+ of leads came from a single, continuously-optimised campaign.
- Kill losers fast. The failed September angle cost CA$108 total — because it was ended in days, not months.
- The biggest win wasn't a number. It was taking a word-of-mouth business online for the first time — and proving to its owner that the internet could reliably hand him installed, paying projects.
"Arun treats the ad account like it's his own money. He's hands-on, tests constantly, and reports in numbers you can actually act on."
Real installations from the campaigns
Not stock photos, not AI renders — jobs sold by these ads and installed in real Toronto homes.


